Introduction

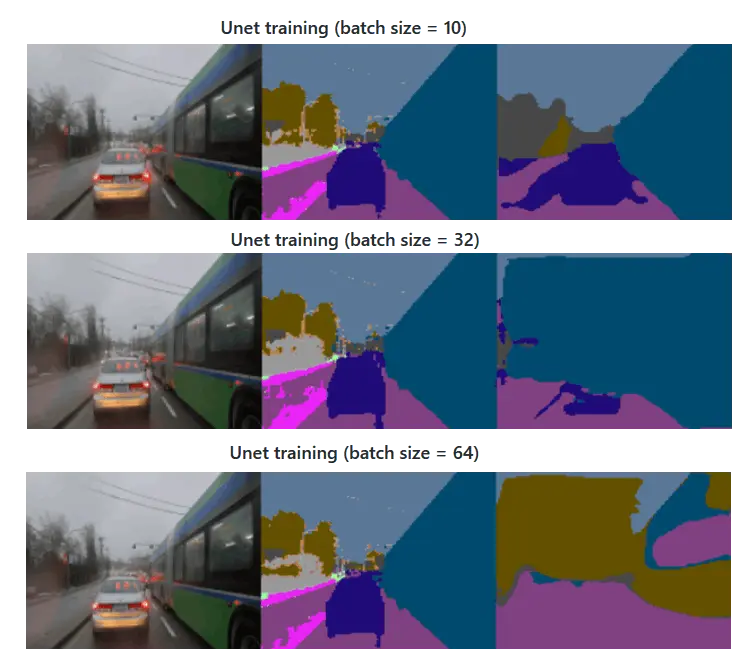
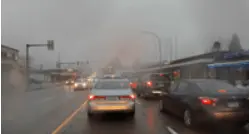
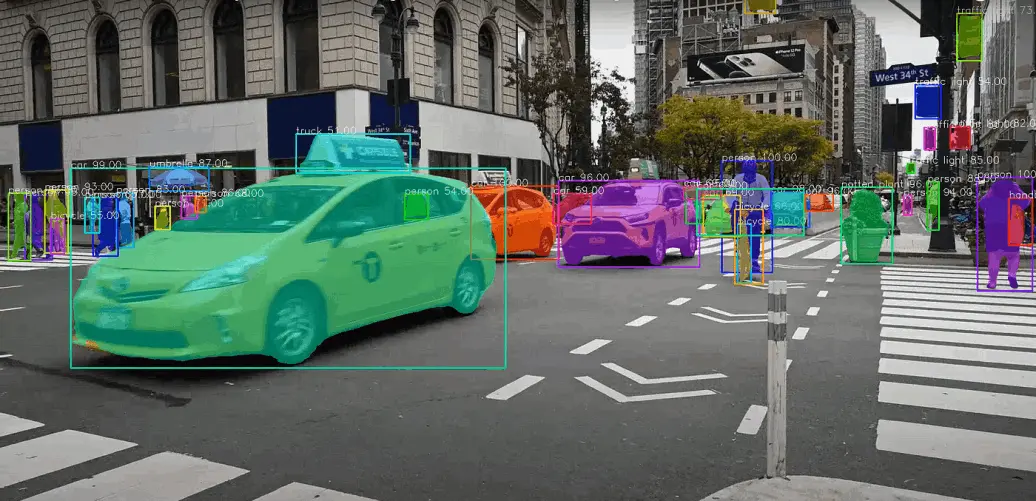
To perceive its environment, an autonomous vehicle relies on advanced sensors like lidars and cameras, which generate lots of raw data. However, this data must undergo extensive processing to derive meaningful semantic and spatial information. Existing image segmentation models perform well under clear conditions but severe weather degrades the quality of image data reducing their performance.

To counter the distortion of images, real-time and post processing techniques have been used to mitigate the effect of severe weather on these images without altering the scene. Additionally, ensembling multiple deep learning models has been shown to improve the accuracy of object detection in unfavorable weather conditions.

Goals

Reliability of camera data is affected due to adverse weather conditions like rainfall. Our primary focus is on designing a model that can excel in these challenging scenarios. Our project aims to create a machine learning model capable of robustly and accurately predicting semantic image labels across the spatial regions within images taken from an autonomous vehicle camera in rainy weather environments.

We used multiple image segmentation methods from GMM to deep learning networks like UNet to see how these can help in segmenting road images in adverse weather conditions. Our goal was to compare these results and see which best suits our task. We used the Raidar dataset consisting of 58,542 images of street scenes taken onboard a self-driving car camera. The dataset includes a pair of 14,570 actual rainy images and their corresponding semantic segmented annotations.

1. Unsupervised Learning: Gaussian Mixture Models (GMM), Hierarchal Clustering (HC)
2. Supervised Learning: Custom CNN (CNN), Unet 

Work Done

It was important to cluster the dataset based on this characteristic to avoid bias and improve model accuracy, and the following methods were explored:
1.Classifying based on the average of the HSV V-channel
2. KMeans algorithm clustering


The first one turned out to be the most reliable indicator of time of day. The mean brightness across the dataset was calculated and used as the threshold for grouping the images.

We chose to employ two distinct methods to segment the images in our dataset; GMM and Hierarchical clustering. These algorithms cluster data points from the images based on their distance in the RGB color channel space. This approach facilitates grouping of objects that exhibit similar colors in close proximity to one another. However, the ground truth labels that we intend to use for classification are not segmented based on the RGB color space. In spite of this, we proceeded to attempt image segmentation using both GMM and Hierarchical clustering in order to evaluate their efficacy in this context. To improve the outcomes, we have experimented with several preprocessing methods such as:
1. Blurring and normalizing
2. Adding white noise
3. Contouring
4. Blob detection

For our supervised method we decided to use a UNet which is a CNN architecture commonly used for image segmentation in medical imaging. The network first “encodes” the image to extract the features of the input similar to a traditional CNN. Each convolution block consists of a 3x3 convolution, followed by regularization and a ReLu step. This is repeated once more then a maxpool calculation is performed.

This encoding step is repeated until the desired depth of the Unet is reached. The next portion of the network “decodes” the extracted features to create a segmentation map which shows the probability of a pixel belonging to a certain class. The decoder performs deconvolution or upsampling and then concatenates the output with the feature map taken from the output of the encoder at the same layer.  

Mobirise Website Builder

Results


The internal measure based methods that compare intra-cluster distances with inter-cluster distances which we used were:
1. Davies-Bouldin Index
2. Silhouette Coefficient
3. Beta CV measure
4. Blob detection


The external measures used were as follows:
Pairwise:
1. Rand’s statistic
2. Jaccard’s coefficient


Entropy based:
1. Normalized Mutual information

Contact me!

📞(404) 388-3944    📍Atlanta, GA, 30309   📧bhushan.pawaskar@hotmail.com

© Copyright 2023 Bhushan Pawaskar - All Rights Reserved